data <- iris |> as_tibble() |> janitor::clean_names()

out <- data |>
  group_nest(species) |>
  deframe()

out <- out |>
  map(\(data) {

    ggplot(data, aes(x = sepal_length, y = sepal_width)) +
      geom_point()

})When working with a list of objects, it may be useful to organize the objects into tabs instead of a huge list of individual objects
Using the iris dataset as a working example, I generate a list of ggplot objects.
The list of ggplot2 objects can be called and presented as below
out$setosa
$versicolor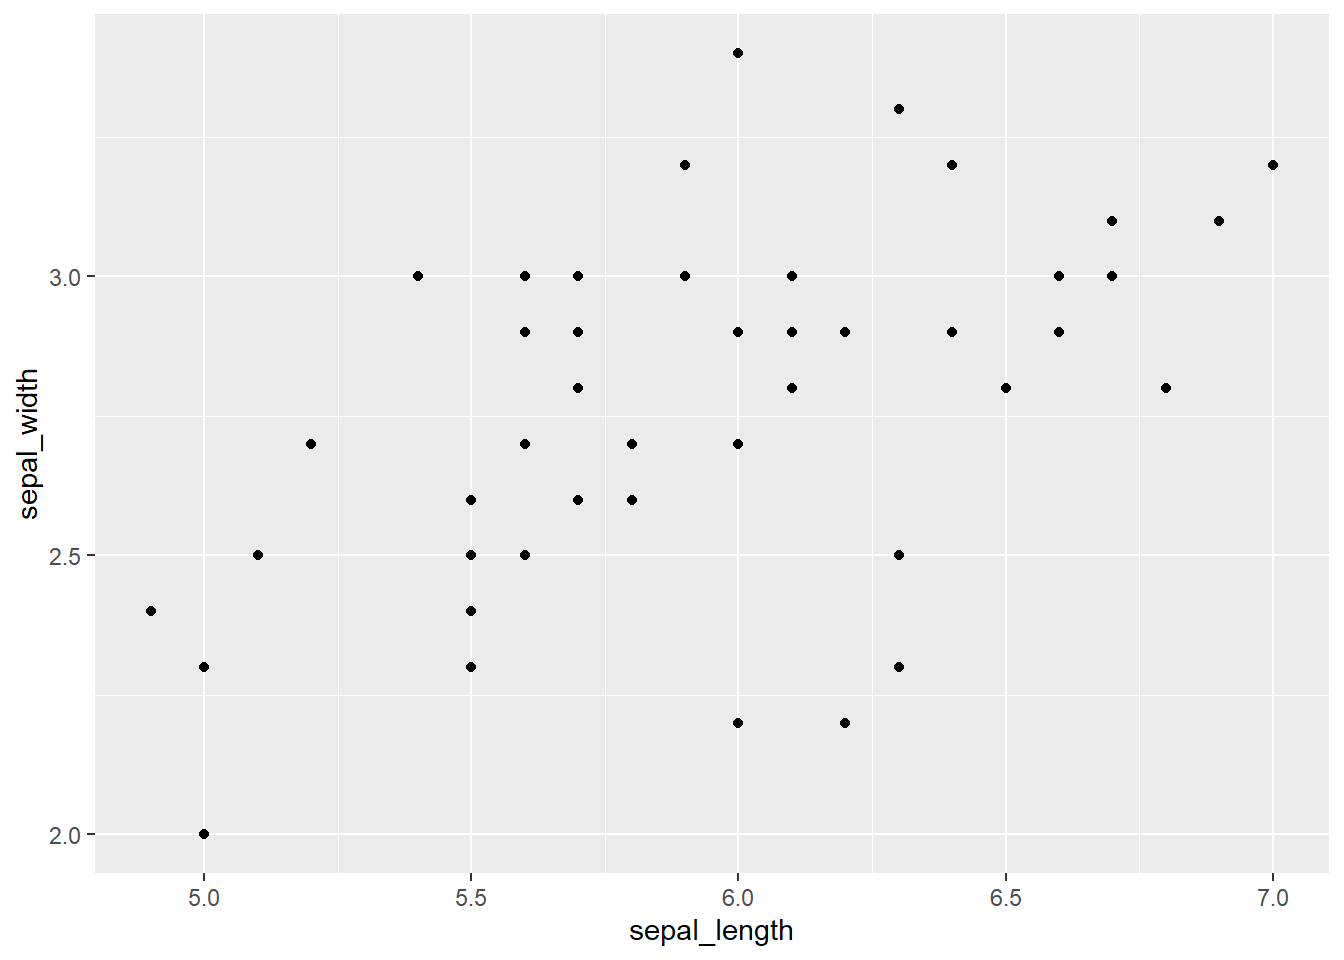
$virginica
Instead of presenting a long list of plots, we can organize the plots into individual tabs. In order to do this, we utilize a combination of imap_chr() and knit_child(). We use imap_chr() to pass on individual plots into knit_child(). We wrap this chunk within a fenced div panel-tabset, and utilize results: asis.
```{r}
#| eval: false

out <- imap_chr(out, \(out, title) {

  text <- glue::glue("## `r title`",
                     "```{r}",
                     "out",
                     "```",
                     "", .sep = '\n\n')

  knitr::knit_child(text = text, envir = environment(),
                    quiet = T)

})

cat(out, sep = '\n')
```out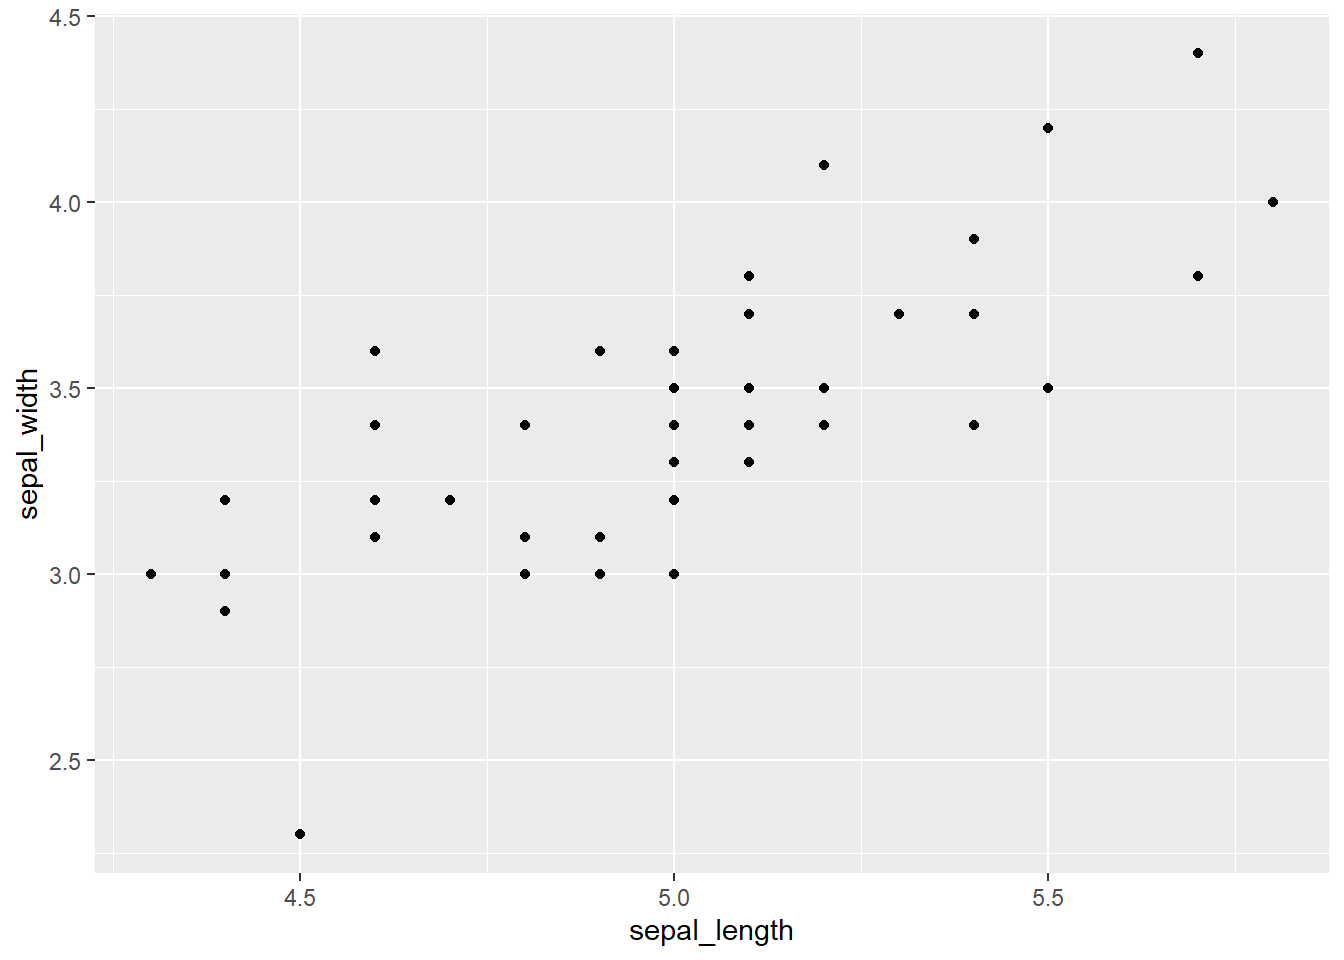
out
out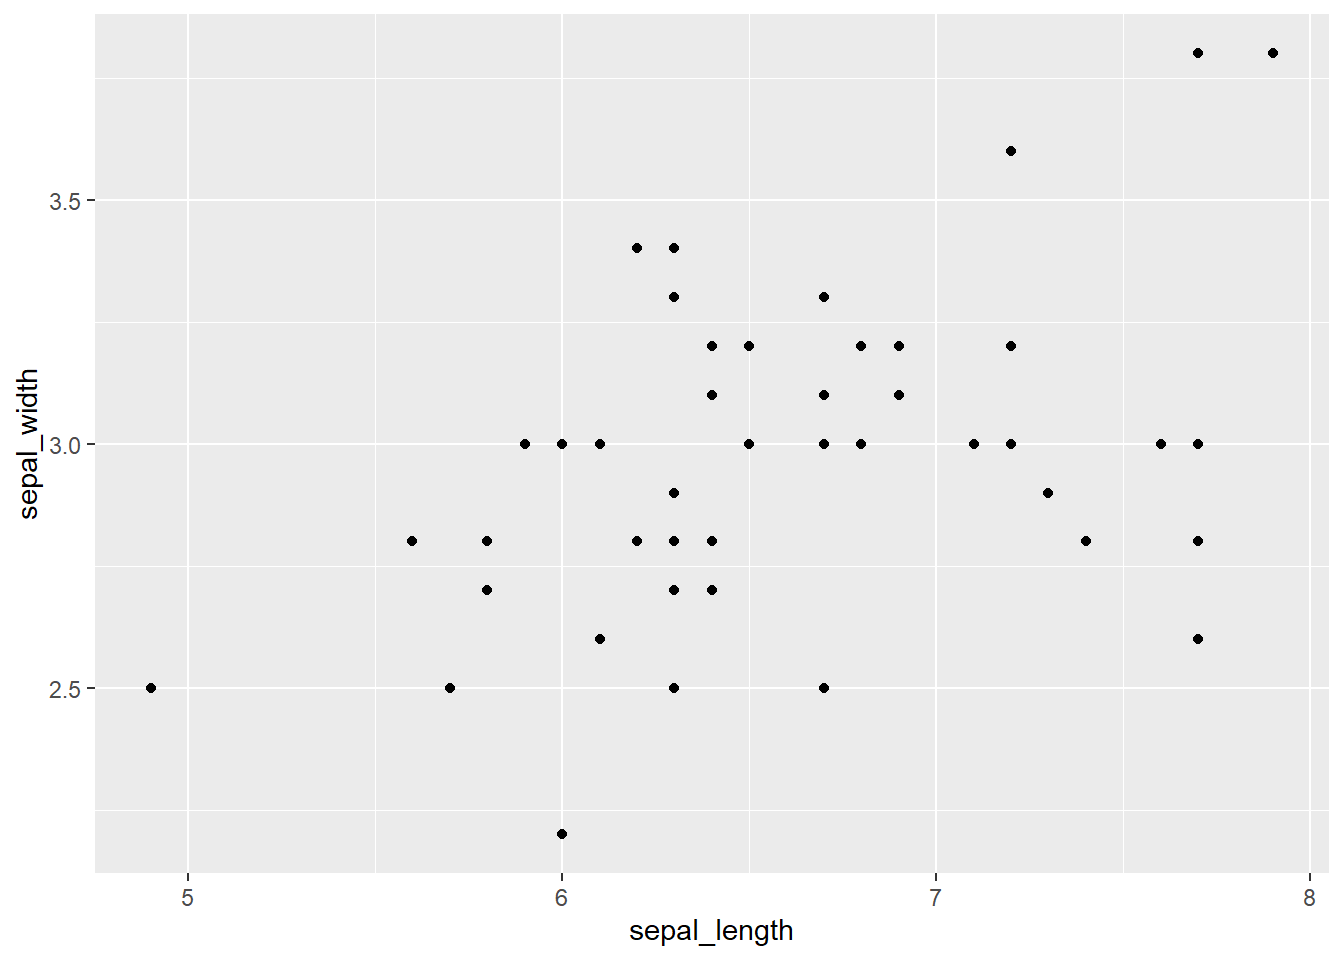
Reuse
Citation
BibTeX citation:
@online{luu2023,
  author = {Luu, Michael},
  title = {Programatically Generate {Quarto} Tabs},
  date = {2023-04-13},
  langid = {en}
}
For attribution, please cite this work as:
Luu, Michael. 2023. “Programatically Generate Quarto Tabs.”
April 13, 2023.