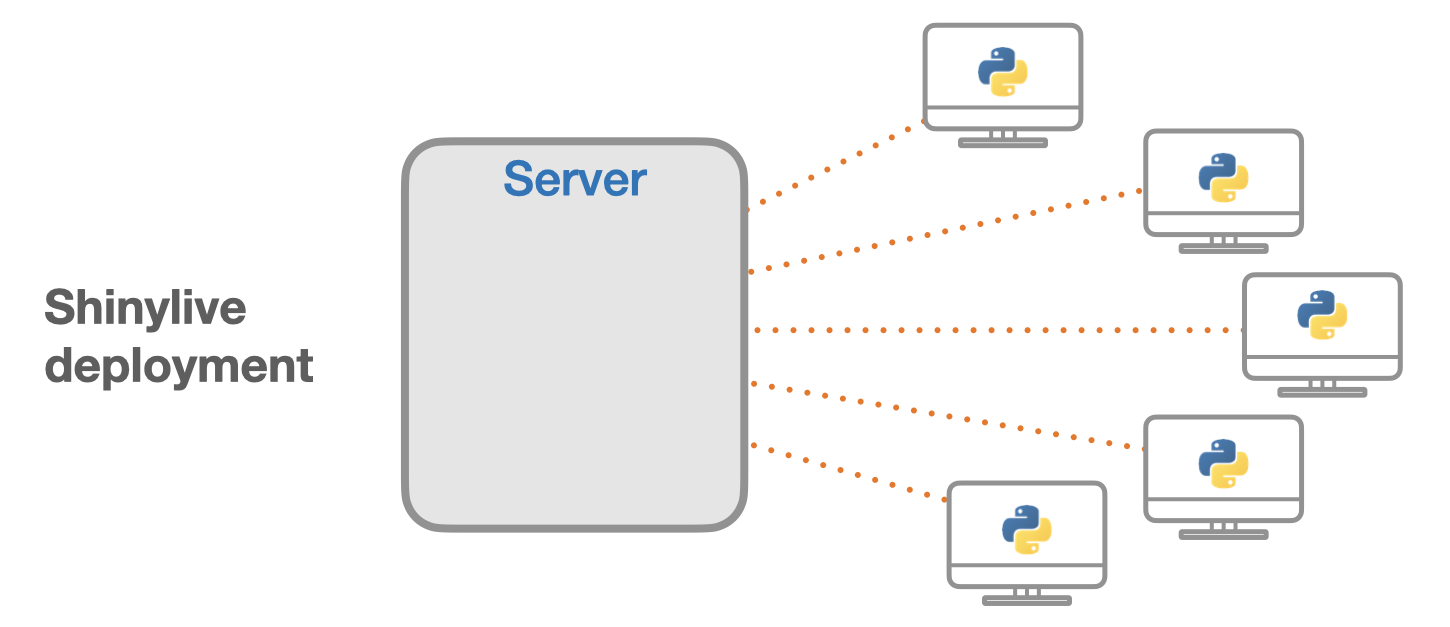
The following blogpost is an example implementation of ShinyLive.
A traditional Shiny application requires a Shiny Server for computation, that handles both the computation and serving the application to the user.

The inverse is true with the implementation of ShinyLive and WebR, where the application can be hosted on a static web server similar to GitHub Pages, and the computation is handled by the user themselves.

The current blogpost is an example implementation of ShinyLive in Quarto using the shinylive-quarto extension. Source code for the current blogpost can be found here.
More information regarding the implementation of shinylive can be found here.
#| standalone: true
#| viewerHeight: 600

ui <- fluidPage(

    # Application title
    titlePanel("Old Faithful Geyser Data"),

    # Sidebar with a slider input for number of bins
    sidebarLayout(
        sidebarPanel(
            sliderInput("bins",
                        "Number of bins:",
                        min = 1,
                        max = 50,
                        value = 30)
        ),

        # Show a plot of the generated distribution
        mainPanel(
           plotOutput("distPlot")
        )
    )
)

# Define server logic required to draw a histogram
server <- function(input, output) {

    output$distPlot <- renderPlot({
        # generate bins based on input$bins from ui.R
        x    <- faithful[, 2]
        bins <- seq(min(x), max(x), length.out = input$bins + 1)

        # draw the histogram with the specified number of bins
        hist(x, breaks = bins, col = 'darkgray', border = 'white',
             xlab = 'Waiting time to next eruption (in mins)',
             main = 'Histogram of waiting times')
    })
}

# Run the application
shinyApp(ui = ui, server = server)
Reuse
Citation
BibTeX citation:
@online{luu2023,
  author = {Luu, Michael},
  title = {Implementation of {ShinyLive} in {Quarto}},
  date = {2023-11-15},
  langid = {en}
}
For attribution, please cite this work as:
Luu, Michael. 2023. “Implementation of ShinyLive in
Quarto.” November 15, 2023.